
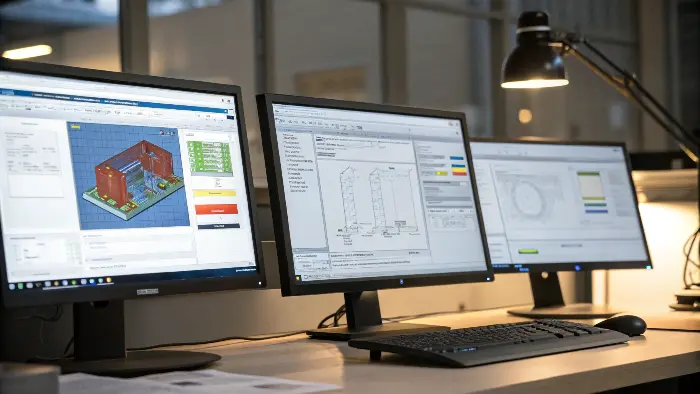
Quick answer: Mold-flow analysis creates value when its predictions change a tool decision and become measurable trial or production controls. Translate flow, pressure, temperature, packing, cooling and warpage risks into gates, vents, circuits, machine requirements, CTQs, trial measurements and reaction limits.
Process boundary: Numerical settings must be developed for the actual resin grade, geometry, mold and machine. Transfer the controlled process signals and limits, not setpoints alone.
Write the Manufacturing Decision Before Running the Model
State the alternatives under consideration and the acceptance criteria. Examples include one gate versus two, cold runner versus hot runner, cavity layout, vent locations, a thick boss correction or whether a target machine has enough pressure and shot-rate margin. This prevents the analysis from expanding into plots that do not change a decision.
Include product CTQs, surface zones, load paths, annual volume and maintenance expectations. The best filling option may not be the best production system if it adds visible gates, difficult service or unstable cavity balance.
Convert Fill Results Into Feed-System Decisions
Use fill progression, pressure drop, shear and front temperature to compare gate type, size, position and runner balance. Record why the selected option protects product function and process margin. For multi-cavity tools, evaluate natural or engineered balance and the likely effect of material and temperature variation.
Define what remains adjustable: gate inserts, runner tuning, hot-runner settings or alternate locations. A model reduces uncertainty but does not eliminate the need for practical correction access.
Process Control Map
| Analysis insight | Tooling response | Production evidence |
|---|---|---|
| Late fill / hesitation | Gate, wall or flow-leader comparison | Short-shot sequence and pressure reserve |
| Air trap | Vent, overflow or parting strategy | Burn location, vent condition and cavity pressure pattern |
| Thermal imbalance | Circuit zoning, baffle, insert or conformal option | Surface temperature, flow, cycle and dimensional trend |
| Warpage driver | Geometry, gate, cooling or material alternative | Datum-based dimensions after defined conditioning |
Turn Air and Weld Predictions Into Tool Features
Map likely end-of-fill regions to parting vents, ejector clearance, inserts or overflow features. Check whether vent placement can be machined, cleaned and maintained. Pair weld-line locations with product loads, sealing, appearance and test requirements. Not every weld line is unacceptable, and not every air-trap marker becomes a burn.
Create a T1 inspection map that labels predicted areas. This makes trial feedback specific: the team can compare actual burn, gloss, weld and fill behavior to the model and adjust the relevant tool feature.
Use Thermal Results to Define Cooling Controls
Identify hot cores, thick masses, action inserts and surfaces with different ejection temperatures. Convert them into circuit zones, channel changes, baffles, bubblers, high-conductivity inserts or a conformal-cooling business case. Check structural steel, seals, water quality and service access before accepting an idealized circuit.
Specify production controls such as circuit connection, coolant temperature, flow and differential pressure. A validated thermal design can still fail when hoses are reversed, passages scale or a low-flow circuit is not detected.
Translate Predicted Variation Into CTQs and Machine Requirements
Use packing and shrinkage results to identify dimensions sensitive to gate freeze, pressure or cooling. Define cavity-level measurements and conditioning time. Compare required pressure, flow rate, shot volume, clamp demand and recovery with the intended machine, allowing reasonable process reserve.
Avoid turning simulation values into arbitrary control limits. Use T1 and validation data to establish actual ranges. The analysis identifies relationships and measurement priorities; production evidence sets the approved window.
Close the Loop Through Trials and Monitoring
Prepare a correlation sheet before T1 with predicted fill order, weld lines, air traps, pressure, hot spots and warpage direction. Collect short shots, process traces, cavity weights, surface temperatures, dimensions and defects under controlled conditions. Explain mismatches through inputs, tool construction, process or measurement.
Carry useful signals into the control plan: material condition, fill time, transfer position, peak pressure, part weight, coolant flow or cavity pressure where justified. Set reaction rules and maintenance checks around the failure mechanism, not around every available machine number.
Process Control Checklist
- Define the tooling or production decision and alternatives before analysis.
- Map product CTQs, load paths, surfaces and maintenance constraints.
- Convert flow results into gate, runner and tuning decisions.
- Make predicted vents and weld lines machinable, inspectable and serviceable.
- Translate thermal risk into circuits, zones and utility controls.
- Check machine pressure, rate, shot, clamp and recovery reserve.
- Prepare a prediction-to-T1 correlation sheet.
- Release only evidence-based process and maintenance controls.
Illustrative Simulation-to-Control Handoff
Illustrative engineering example—not a claimed CKMOLD customer result: A four-cavity housing model predicts one cavity will fill last and a deep core will stay hotter than the surrounding steel. The tool team preserves runner-tuning access and separates the deep-core cooling circuit. T1 then records cavity weights, fill sequence, circuit flow and a flatness dimension. Those measurements determine runner adjustment and the released coolant-flow check.
Implementation Questions
Can mold-flow output be used directly as production limits?
Usually no. It identifies expected relationships and risk; actual approved limits should be established through mold-trial and validation evidence.
Which results should be checked at T1?
At minimum compare fill progression, weld and air locations, pressure demand, cavity balance, temperature patterns and critical dimensional or warpage trends relevant to the study.
How does mold flow help cooling design?
Thermal results identify heat concentration and imbalance that can guide circuit zoning and hardware, then physical flow and temperature must be verified.
Does a balanced simulation support balanced cavities?
No. Hot-runner variation, machining, venting, temperature, gate condition and material can change physical balance. Preserve tuning and measure each cavity.
Implementation Resources
Apply the Using Mold Flow Analysis to Define Tooling and Production Controls review to your released design. Share the function, exact resin, annual volume, CTQs, cosmetic limits and launch timing through the CKMOLD project form. If CAD is relevant, send it directly to jerry@ckmold.com; the form does not require an upload.